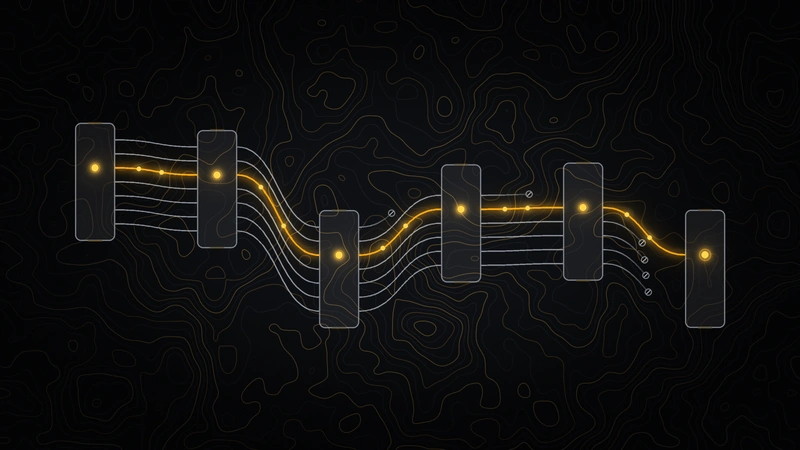
A Discord page at 8:12 PM said our web box and the Cloudflare edge were down. Prod was serving 800 to 1700 requests a minute straight through it.
The box’s own TCP probe said it was up, and so did its collector. Only one failed HTTP read from the monitor said otherwise, and the page fired on that single read. The session to untangle it ran 6h 24m.
Replaying 385 builds
We fixed the monitor in three layers, then replayed all 385 recorded builds through the new logic. The old logic paged four times across that history. The new logic paged zero. A real outage still paged, which mattered as much as the zero.
Then we went to close the ticket that tracked the fix, and the close tooling ran into its own bad assumption.
The weekly train that wasn’t there
The close tooling in our ops repo assumed every repo for our product ships on the weekly release train. Some repos deploy continuously. Closing that ticket exposed the gap, and we changed the tooling so continuously-deployed repos are modeled properly.
A ticket with no branch
Another ticket had the same shape. Its fix was a server-side SSH change, so there was no branch to trigger the normal close path. The work was fixed and verified but never closed. We re-verified that the mail server clock and its hourly cron were still holding, then closed the ticket as NO CODE and moved it onto the email tools epic, where the rest of that investigation lives.
A bot that couldn’t say what it was running
We ended the monitor session by making the Assistant bot’s droplet a real checkout, because nothing there knew what revision was running. It turned out not to have drifted, and the bot had never restarted.
Hotfixes in the wrong order
We also diagnosed the CI back-merge guard alerts as an ordering slip on a set of hotfixes. Master got the code minutes before develop. We confirmed everything had settled green, then shipped and verified a pre-push guard across all 30 clones so develop-first violations get blocked at push time instead of paging.
One picture of how work flows
Each of these tools was built around a single picture of how work moves. The close tooling assumed a weekly train. The close path assumed a branch behind every fix. The bot’s server had no way to report what it was running. The monitor had the same flaw: it trusted one HTTP read over a TCP probe and a collector that both disagreed with it.
For each monitor and each close or release tool you depend on, it is worth writing down what picture of the work it assumes: a single HTTP read, a weekly release train, a branch behind every fix, a server that can report its own revision. Replaying recorded history, as we did with the 385 builds, shows whether a change pages when it should and stays silent when it shouldn’t.
AI Skills
Use this lesson with the AI assistant you already use
A monitor paged that the web box and Cloudflare edge were down while prod kept serving 800 to 1700 requests a minute, because one failed HTTP read outvoted a TCP probe and a collector that both said the box was up. While closing the ticket for that fix, the close tooling, a branchless SSH-only ticket, and an unreportable bot server each exposed the same kind of hidden assumption.
Paste the prompt, share only the context needed to answer it, and treat the result as a draft for your review. Do not include confidential information or let an AI assistant make changes without your approval.
Optional: for a visual report and saved memory, run /dxdev first.
Don’t have it? Get it at dxdev.com/skills/dxdev. The prompt works without it.
dxdev LESSON · paste into your AI coding agent
LESSON: Audit The Single Picture Of How Work Flows That Each Tool Was Built Around
SOURCE: dxdev.com/blog/close-tool-assumed-release-cadence
WHAT HAPPENED: The 8:12 PM page fired on a single failed HTTP read even though the TCP probe and the box's collector disagreed with it. The monitor was fixed in three layers and replayed against 385 recorded builds, where the old logic paged four times and the new logic paged zero, while a real outage still paged. Closing the ticket then showed that the close tooling assumed every repo ships on a weekly release train, when some repos deploy continuously. Another ticket had a server-side SSH fix with no branch, so the normal close path never triggered and the work sat fixed but unclosed until it was closed as NO CODE. The Assistant bot's droplet had no way to report what revision it was running, and the CI back-merge guard alerts came from hotfixes landing on master before develop.
THE RULE: When a tool misbehaves, ask what single picture of the workflow or system it was built around, and look for other tools sharing that picture. Do not let one signal decide an outcome when independent signals disagree, and make sure tools model the exceptions such as continuous deploys, branchless fixes, and unknown running revisions.
CHECK MY CODE, then report PASS or FAIL with file:line for each:
      1. Does any alert fire on a single failed read when an independent probe or collector reports the target as healthy, and has the new alert logic been replayed against recorded history to confirm it pages on a real outage but not on the past false alarms?
      2. Does your close or release tooling handle repos or tickets that do not follow the default flow, such as continuously deployed repos or fixes with no branch, instead of assuming a weekly train or a branch always exists?
      3. Can every deployed service report the exact revision it is running, and is the required merge order, such as develop before master, enforced by a guard at push time instead of discovered through alerts afterward?
THEN PRINT: a table (check, PASS/FAIL, evidence, fix) + a verdict (applies / partially / OUT_OF_SCOPE / no) + the single most important next action.